Vision & Commitments
Our Business
Sustainable Solutions
Governance
Environmental Performance
Our People
(see further details here)
Units | 2020 | 2021 | 2022 | |
---|---|---|---|---|
Sales | $ millions | 5,043 | 6,955 | 10,015 |
Operating Income | $ millions | 202 | 2,611 | 3,516 |
Adjusted Operating Income | $ millions | 509 | 1,194 | 3,509 |
Total Adjusted Net Income - Shareholders of The Company | $ millions | 258 | 824 | 2,350 |
Cash Flow From Operating Activities | $ millions | 804 | 1,065 | 2,025 |
(see further details here)
Units | 2019 | 2020 | 2021* | 2022 | ||
---|---|---|---|---|---|---|
GHG | Total Scope 1+2 | CO2e tonnes (thousands) | 2,649 | 2,507 | 2,538 | 2,407 |
Scope 1 | CO2e tonnes (thousands) | 2,233 | 2,140 | 2,158 | 2,126 | |
Scope 2 (Market) | CO2e tonnes (thousands) | 416 | 367 | 380 | 281 |
* An independent assurance process was performed by an external expert, which included verification and validation in accorded with ISO 14064-3 standard for greenhouse gas statements.
** ICL expects to further refine its Scope 3 emissions data collection procedures over time and to include data on Scope 3 emissions in future Disclosures.
(see further details here)
Units | 2018 | 2019 | 2020 | 2021 | 2022 | |
---|---|---|---|---|---|---|
Total Energy Consumption | Million GJ | 35.3 | 36.52 | 33.8 | 34 | 35.12 |
*2022 is the first year in which we are including the data of several production plants in Brazil that ICL acquired in 2021.
**Total energy consumption currently excludes steam and electricity self- generated from exothermic reactions that occur as part of our production process.
(see further details here)
Units | 2020 | 2021 | 2022 | ||
---|---|---|---|---|---|
Air | NOx | tonnes (thousands) | 1.5 | 1.3 | 1.17 |
SOx | tonnes (thousands) | 2.5 | 2.5 | 2.49 | |
PM | tonnes (thousands) | 0.53 | 0.47 | 0.38 | |
VOC | tonnes (thousands) | 0.088 | 0.086 | 0.093 | |
NH3 | tonnes (thousands) | 0.008 | 0.011 | 0.0075 |
(see further details here)
2021 | 2022 | ||
---|---|---|---|
Water withdrawal by source | Water withdrawal by quality | All areas | All areas |
Surface water (total) | 15 | 13.5 | |
Freshwater | 1.5 | 1.4 | |
Other water | 13.5 | 12.1 | |
Groundwater (total) | 21 | 26.2 | |
Freshwater | 1.7 | 1.8 | |
Other water | 19.3 | 24.4 | |
Groundwater - fossil water (total) | 10.3 | 9.2 | |
Freshwater | 0 | 0 | |
Other water | 10.3 | 9.2 | |
Sea water (total) | 5.6 | 4.1 | |
Freshwater | 0 | 0 | |
Other water | 5.6 | 4.1 | |
Third party water (total) | 17.1 | 16.4 | |
Freshwater | 17 | 16.4 | |
Other water | 0.1 | 0.1 | |
Total | 69 | 69.5 | |
Freshwater | 20.2 | 19.6 | |
Other water | 48.8 | 49.9 |
*Note: In 2021, we completed the acquisition of two companies in Brazil. As this is a relatively new acquisition, the environmental data (GHG emission, energy consumption, etc.) published in regards to 2021 does not include data from these sites. In the current (2022) report, the 2022 environmental data from these production sites is fully included.
(see further details here)
HAZARDOUS WASTE | 2021 - thousand tonnes | % | 2022 - thousand tonnes | % | |
Recovery | Recycling/reuse | 5.6 | 19% | 4.8 | 17% |
Incineration (with energy recovery) | 1.8 | 6% | |||
Disposal | Landfill | 12.1 | 41% | 18.4 | 64% |
Incineration (without energy recovery) | 11.8 | 40% | 3.8 | 13% | |
Total | 29.5 | 28.8 | |||
NON-HAZARDOUS WASTE | |||||
Recovery | Recycling/reuse (including energy recovery) | 35.61 | 57% | ||
Disposal | Landfill (including incineration) | 27.6 | 44% | ||
Total | 61** | 63.2* |
*The 2022 figures include new facilities acquired in Brazil, which were not included in 2021. On a same site basis, non-hazardous waste has slightly reduced year over year.
**The 2021 non-hazardous waste figures were updated following a data refinement process and adoption of international standards in preparation for Scope 3 disclosure.
(see further details here)
To ensure its goal of promoting gender equality, ICL is implementing and monitoring the following diversity KPI’s, and has set the following quantitative diversity goals, to be reached by 2024. These KPIs show improvement since 2019, indicating that ICL’s efforts to promote gender equality are providing beneficial results.
End of 2022 | 2024 Target | |
---|---|---|
Women in Senior Management | 23% | 25% |
Women in ICL Board of Directors | 33% | 25% |
We are continuously tracking both lagging and leading indicators. In 2022, we added multiple indicators as they are defined by the SASB methodology.
(see further details here)
Units | 2020 | 2021 | 2022 | |
---|---|---|---|---|
RTO | # | 94 | 94 | 89 |
IR Rate - Direct Employees* | # | 0.92 | 0.77 | 0.62 |
SI Rate - Direct Employees | # | 27.26 | 26.38 | 17.73 |
Accidents - Direct Employees | # | 39 | 78 | 69 |
Accidents - Contractor Employees | # | 16 | 46 | 51 |
Fatalities - Direct Employees | # | 0 | 0 | 1 |
Fatalities - Contractor Employees | # | 2 | 0 | 0 |
Transportation Incidents** | # | 0 | 0 | 1 |
*The IR figures for 2020 and 2021 have been updated compared to the 2021 ESG report due to an implementation of a new IT system that consolidated all safety related data, resulting in a more accurate representation. At ICL, the safety and well-being of our employees are of paramount importance to us. We strive for a culture of zero incidents, where every individual feels secure and protected in their work environment. We prioritize implementing stringent measures to ensure their safety and consistently endeavor to enhance our safety protocols. Regrettably, in February 2022, we experienced a fatality of one of our employees in an accident at our YPH Joint Venture site in China. Following a thorough investigation, the authorities concluded that the incident did not warrant charges against our company, and no sanctions were imposed. This was the first fatality involving an employee we experienced in the past five years. Despite our ongoing efforts, we were deeply saddened to face another fatal incident at our Green-Leaf award winning ICL Iberia site in Spain in March 2023. We are fully cooperating and maintaining transparent communication with both the local authorities and our internal investigation team. This collaborative approach ensures a comprehensive examination of the incident and allows us to identify any potential areas for improvement within our safety management systems. We remain committed to learning from these unfortunate incidents and taking all necessary measures to prevent such tragedies in the future. The safety and well-being of our employees will always remain our top priority.
** Transport incidents are those that occurred during the transport of materials to or from ICL sites, as defined by SASB RT-CH-540a.2
2022 | |
---|---|
Total recordable incident rate - Direct Employees (TRIR) | 1.19 |
Total recordable incident rate - contract Employees (TRIR) | 1.82 |
Fatality rate - Direct Employees | 0.009 |
Fatality rate - Contract Employees | 0 |
Process Safety Incidents Count (PSIC) | 18 |
Process Safety Total Incident Rate (PSTIR) | 0.16 |
Process Safety Incident Severity Rate (PSISR) | 0.94 |
ICL focuses on proactive leading indicators in order to create a strong safety culture and prevent EHS related events from occurring. Several crisis and emergency drills are performed annually in each site to ensure personnel preparedness. EHS external audits and other assessments are performed in accordance with EU Seveso Directive, OSHA PSM regulation, UK HSE control of major accidents and other leading frameworks, in all ICL operations, including contractors.
2021 Actual vs. Planned | 2022 Actual vs. Planned | |
---|---|---|
PSM Risk Assessment | 226 vs. 198 | 438 vs. 280 |
EHS Audits | 392 vs. 375 | 465 vs. 325 |
Job Safety Analysis (JSA) | 930 VS. 667 | 1519 VS. 900 |
Emergency drills | 636 vs. 267 | 526 vs. 228 |
Crisis Management Team drills | 66 vs. 55 | 62 vs. 52 |
Proactive Learning | 1855 vs. 1046 | 3043 vs. 763 |
Engineering & Technological Defenses | 346 vs. 224 | 885 vs. 318 |
Valid Permits & License | 99% vs. 99% | 99% vs. 99% |
Hazard Recognition Indicator (HRI) | 3.26 VS. 2.87 | 0.52 VS. 0.48 |
Near Miss Reports | 2819 vs. 1335 | 2619 vs. 1080 |
EHS Training programs | 95% vs. 95% | 97% vs. 95% |
ICL endorses and follows a variety of initiatives and quality management systems to improve and streamline processes and performance, as well as to reduce risks. The great majority of ICL’s production facilities are certified with ISO standards or with equivalent standards for environmental management, safety and quality. All major energy consuming sites are certified with the energy ISO standard. Food and pharma production sites are certified with GMP/Q7 or other designated standards for the food and pharma industries.
2020 | 2021 | 2022 | ||
---|---|---|---|---|
ISO 14001 or an equivalent standard for environmental management | % of production sites certified | 93% | 84% | 81% |
OHSAS 18001/ISO45001 or an equivalent standard for safety | % of production sites certified | 91% | 81% | 81% |
ISO 9001 or an equivalent standard for quality | % of production sites certified | 94% | 94% | 92% |
Energy management- ISO 50001 | % of production sites certified | 90% | 90% | 76% |
(see further details here)
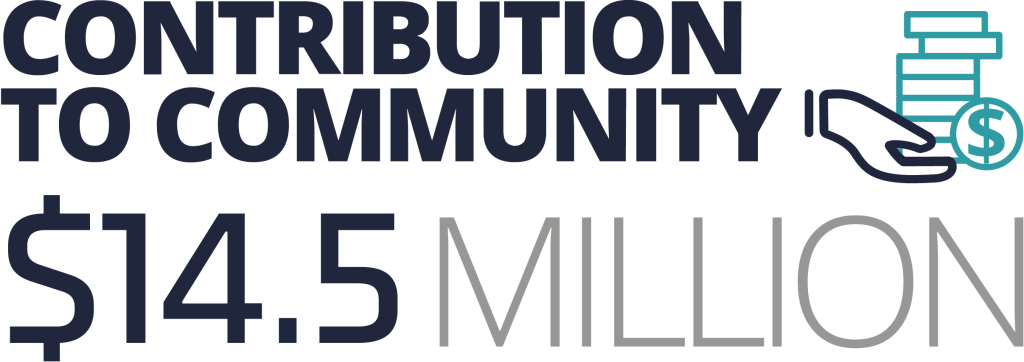
ICL’s monetary donations in 2022 amounted to approximately $14.5 million (including the amount invested in the Visitor Center). In addition, during 2022, ICL contributed, at the Company’s expense, about 24,500 hours of volunteer work for its employees. This amount does not include 35,520 hours of volunteer work after working hours, which was encouraged, organized, and logistically facilitated by ICL.
(see further details here)
Performance | 2022* | As of Today |
---|---|---|
Total number of directors | 12 | 11 |
Number of non-executive Directors on Board | 11 | 10 |
Number of independent Directors (NYSE Rules) | 7 | 7 |
Number of independent Directors (Israeli Law) | 5 | 5 |
Separate Chair & CEO | Yes | Yes |
Annual Board Evaluation Process | Yes | Yes |
Annual Election of Directors | Yes** | Yes** |
Average Age of Directors | 59 | 57 |
Average Directors Tenure | 6*** | 6*** |
Women Board Board Members | 33% | 36% |
* The definition of “external directors” is pursuant to Israel’s Companies Law, 5759-1999 (the “Companies Law”).
** Seven directors are independent directors under the rules applicable to U.S companies listed on the NYSE. Five are independent according to Israeli regulations.
For more details on ICL’s Board see ICL’s 2022 Annual Report and Articles of Association.
Current Chapter